
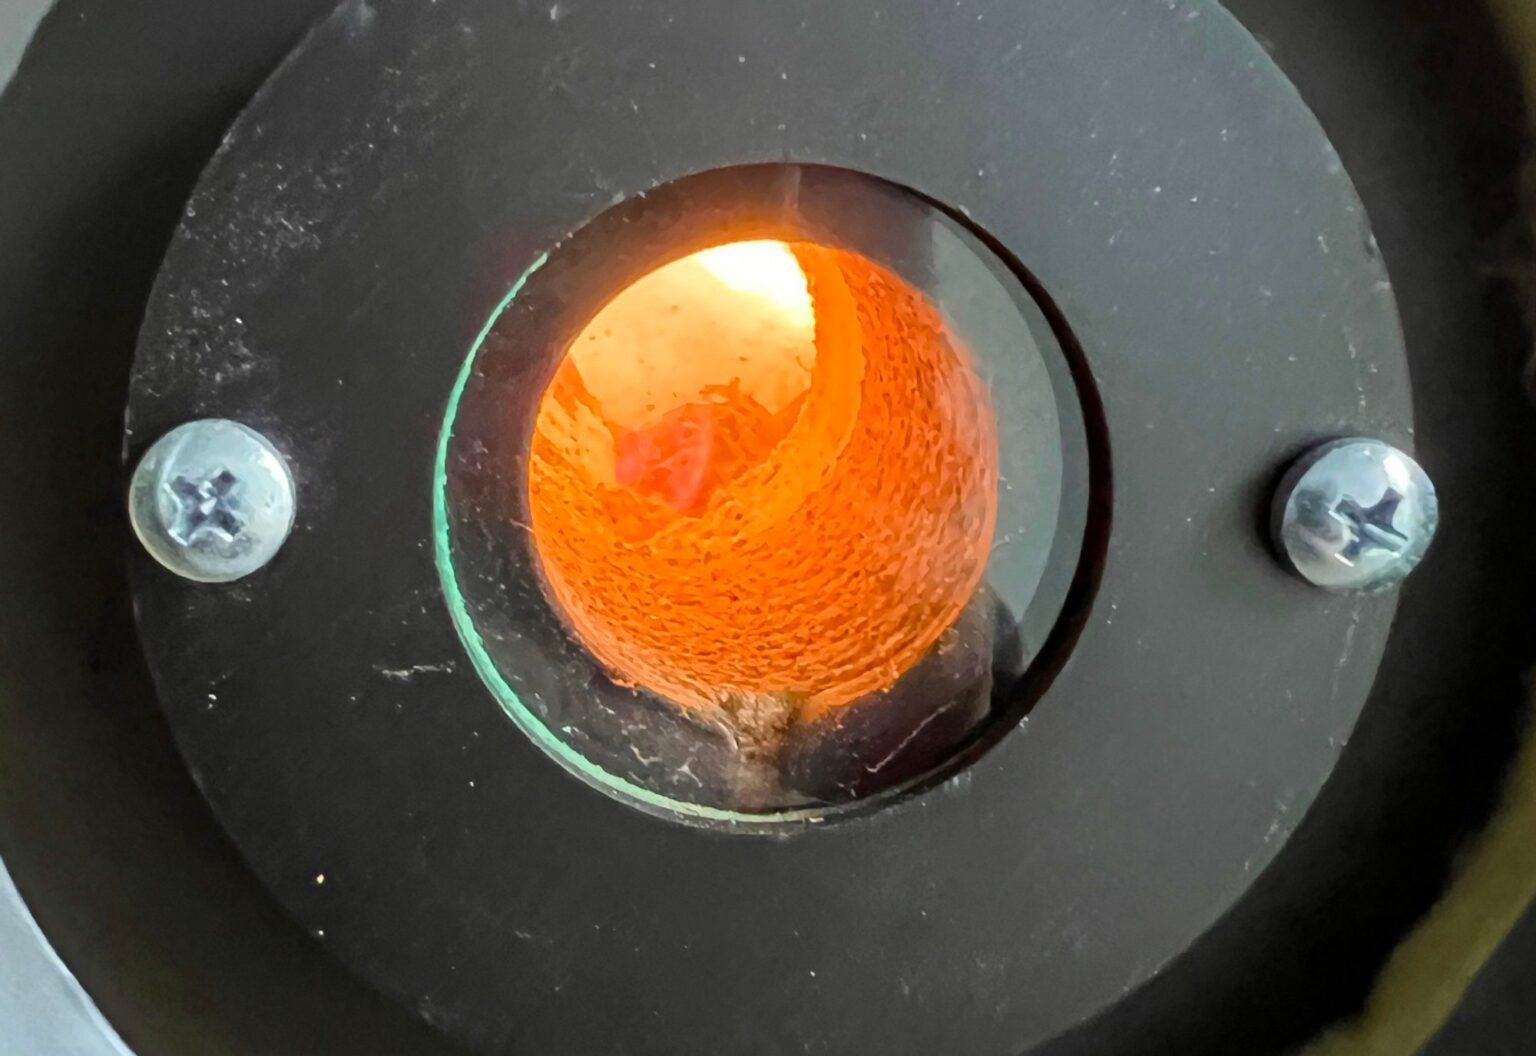
Pyrolysis & biochar
Biochar carbon removal: permanent CO₂ removal with certified credits
We support pyrolysis projects from biomass to a certified removal credit – with measured permanence, a conservative balance and in line with the EU CRCF.
Why permanence matters
Short-lived credits cannot balance long-lived CO₂
Many of the credits traded today are based on avoidance or on stores that last only decades. A significant share of fossil CO₂, however, keeps affecting the climate for centuries to millennia. Anyone who wants to neutralise residual emissions credibly needs removals whose durability is measured, not just claimed.
Biochar is the most mature method for this today: according to CDR.fyi, 86% of all durable carbon removals actually delivered since 2022 came from biochar.
The path to a sink
From biomass to a stable carbon sink
1 · Biomass
Residues and wood from short rotation coppice, agroforestry and landscape management – sourced sustainably and traceably.
2 · Pyrolysis
Carbonisation without oxygen. Our target for pilot plants: at least 600 °C – above this the char is safely in the stable range.
3 · Quality
Targets per batch: H/Corg < 0.4 and O/Corg < 0.2. At these values all permanence models agree.
4 · Application
Applied to soils or bound into building materials – documented so the sink remains verifiable.
Science
How permanent is biochar? Three measurement methods compared
Permanence is the period over which the carbon remains stored. Registries work with fixed periods of 100, 200 and 1,000 years. Three approaches are currently under discussion:
| H/C ratio + incubation | Random reflectance (Rₒ) / inertinite benchmark | Unified model (Sanei et al. 2026) | |
|---|---|---|---|
| Basis | Decomposition trials in soil over 1–9 years, extrapolated (Woolf et al. 2021; Azzi et al. 2024) | Comparison with natural inertinite in rock; ~500 individual particles measured under the microscope | Accelerated oxidation in the lab, calibrated against soil trials |
| Typical period | 100 / 200 years | 1,000 years and more | 100 to 10,000 years |
| In the EU CRCF | Yes (200-year decay function) | Yes (Rₒ method, ~1,000 years) | No (very new) |
| Strength | Cheap, fast, standardised | Detects poorly carbonised fractions and admixtures | Explains large differences at H/C 0.5–0.7 |
| Limit | Large scatter; little discrimination below H/C 0.5 | More effort, trained staff needed | Few calibration points, not yet independently confirmed |
Concrete, peanut butter and jam
A vivid image from Prof. Hamed Sanei (Aarhus University): a biochar particle consists of concrete (the very stable, inertinite-like fraction), some peanut butter (poorly carbonised particles) and a thin coat of jam (reactive carbon on the surface). Two chars with the same H/C value can contain very different amounts of “concrete” – the H/C ratio only shows the average, random reflectance shows the distribution.
What geology tells us
Above a reflectance of Rₒ = 2%, biochar behaves like natural inertinite, which has survived in sedimentary rocks for millions of years. In the study by Sanei et al. (2024), 76% of the commercial biochars examined were above this threshold. A laboratory kinetic model under highly oxidising conditions at 30 °C gives a half-life in the order of 100 million years for typical inertinite biochar. This is a model value – for credits we deliberately calculate with the much shorter periods used by the standards.
Rule of thumb: below about 550 °C biochar stays at the edge of the 2% threshold; from about 600 °C it is safely above it. In an Italian vineyard, biochar was recovered and analysed directly by Rₒ after 15 years in the soil (Chiaramonti et al. 2024).
Go deeper: our expert article “How permanent is biochar? H/C, random reflectance and the EU CRCF” explains formulas, thresholds and worked examples in detail.
Our accounting rule
We calculate with the lowest value
Depending on the model, the same char gives different shares still stored after 100 years. Below H/C 0.5 the models are close together; above that they diverge widely. That is why every balance we prepare uses the lowest value as a safety margin.
| H/Corg | Woolf (linear) | Azzi (power) | Sanei (unified) | Balance value (minimum) |
|---|---|---|---|---|
| 0.3 | 85% | 94% | ~95% | 85% |
| 0.4 | 79% | 94% | ~90% | 79% |
| 0.5 | 73% | 93% | ~81% | 73% |
| 0.6 | 66% | 92% | ~39% | 39% |
| 0.7 | 60% | 91% | ~10% | 10% |
Worked example: 1 tonne of biochar
- 1 t biochar (dry matter) with 70% organic carbon = 0.70 t C
- 0.70 t C × 44/12 = 2.57 t CO₂ maximum storable
- At H/C 0.4 and our accounting rule (79%): about 2.0 t CO₂ for 100 years
- At H/C 0.6 (e.g. temperature too low): only about 1.0 t CO₂ – better process control helps more than any measurement here
That is why we design plants for high temperatures and low H/C values and measure in three stages: H/C per batch, continuous proxy measurement on site, random reflectance as a spot check.
Framework & standards · as of October 2026
Regulatory context
EU CRCF
Framework Regulation (EU) 2024/3012, in force since 26 December 2024. The biochar methodology is set out in Delegated Regulation (EU) 2026/285, in force since 7 May 2026 – with two routes: a 200-year decay function (H/C and soil temperature) and the random reflectance method (~1,000 years). Certification schemes are currently going through the Commission’s recognition procedure.
Voluntary market
Puro.earth issues CORC100+ (Edition 2022) and CORC200+ (Edition 2025) for biochar, was confirmed as a CCP-eligible programme by the ICVCM in December 2025 and applied for CRCF recognition in June 2026. In August 2025 the ICVCM rated three biochar methodologies as “CCP-approved” (including Isometric and Verra VM0044).
EBC – quality
The European Biochar Certificate defines quality requirements, including H/Corg < 0.7. Important: this limit describes product quality, not permanence – it is precisely in the 0.5–0.7 range that the models diverge most.
SBTi & ESRS
Under SBTi, permanent removals are used to neutralise remaining residual emissions – they do not replace reductions. Under ESRS E1, removals and purchased credits are reported separately from a company’s own emissions.
Who benefits
Who pyrolysis projects are for
Companies
Neutralise residual emissions with measured, permanent removals – once reductions have been exhausted. Transparent for CSRD reporting and stakeholders.
Farmers
New income from residues and agroforestry, better water retention in the soil and a product with a double benefit.
Municipalities
Use green waste and landscape wood regionally, recover heat and keep value creation local.
Investors
Revenue from char, credits and heat. Profitability depends heavily on the site – we work through your case with conservative assumptions.
Free guide
Pyrolysis & carbon removal at a glance
Scientific basics, economics and regulation on 15 pages. After submitting the form, the download link appears right here.
Questions? info@tgo.ag · +49 4474 949550
Sources
- Sanei, H. et al. (2024): Assessing biochar’s permanence: An inertinite benchmark. International Journal of Coal Geology. pub.geus.dk
- Sanei, H. et al. (2026): A unified framework for biochar carbon permanence. International Journal of Coal Geology 324, 105075.
- Woolf, D. et al. (2021), Environmental Science & Technology; Azzi, E. S. et al. (2024), Geoderma – H/C-based permanence models.
- Chiaramonti, D. et al. (2024): 15-year-old biochar in a vineyard (Italy).
- Delegated Regulation (EU) 2026/285 and Regulation (EU) 2024/3012 – EUR-Lex
- CDR.fyi (2025): Biochar Carbon Removal Market Snapshot
- ICVCM (2025): biochar methodologies CCP-approved; Puro.earth: Biochar permanence
Status: October 2026. Analysed by Bernhard Aumann, tgo AG, as part of the Interreg project Smart Carbon Farming.
FAQ
Frequently asked questions about biochar carbon removal
At 70% organic carbon, a maximum of about 2.57 t CO₂ is stored. With our conservative accounting rule (H/C 0.4, lowest model value) we calculate about 2.0 t CO₂ over 100 years.
Yes. The biochar methodology is set out in Delegated Regulation (EU) 2026/285 under the CRCF, in force since 7 May 2026. Certification schemes such as Puro.earth are currently going through the Commission’s recognition procedure.
The European Biochar Certificate (EBC) describes product quality, including H/Corg < 0.7. The CRCF governs how permanent carbon removals are measured and certified – with its own permanence requirements.
For reliable permanence we recommend at least 600 °C. Below about 550 °C the char stays at the edge of the inertinite threshold (Rₒ 2%), and permanence models diverge widely.
Prices depend on the registry, durability class and volume. In our balances we deliberately use cautious assumptions and assess each case individually.

Genuine CO₂ tonnes from the field – humus, hedges, biochar. Measured, registered, regional: contribution instead of offsetting.
See genuine tonnes at Carbo Farm →